From Planner to Power BI: Build Dashboards for Task Management Insights
From Planner to Power BI: Build Dashboards for Task Management Insights
Unlock actionable insights by connecting Microsoft Planner with Power BI — learn how IT professionals and project managers can build dynamic dashboards from Planner data to track tasks, monitor progress, and improve decision-making.

This is where Microsoft Power BI comes in. By combining Planner with Power BI, you can transform raw task data into insightful dashboards, real-time reports, and analytics that help you understand project health, team workload, completion rates, and more.
In this guide, you’ll discover several effective methods — from no-code connectors to API-based workflows — for bringing Planner data into Power BI. Then you’ll learn how to build powerful dashboards to turn task data into meaningful insights.
Understanding the Challenge: Planner Doesn’t Natively Connect to Power BI
One major limitation: Planner does not have a native connector built into Power BI. (Microsoft Learn)
That means you cannot simply “Get Data → Planner” in Power BI out of the box. Instead, you must rely on alternative methods: using third-party connectors, exporting data via automation, or leveraging APIs/datafeeds for integration. (CData Software)
Depending on your setup (standard Planner, Planner Premium/Dataverse-based environment), available options may vary. (Microsoft Support)
Use a Third-Party Connector (e.g. CData Connector)
One of the easiest ways to integrate Planner with Power BI is by using a specialized connector such as the CData Power BI Connector for Microsoft Planner. This connector enables Power BI Desktop (or Service via gateway) to access live Planner data directly. (CData Software)
How it works:
Once connected, you can build dashboards in Power BI just like with any other data source.
Use Automation (e.g., via Power Automate / Scheduled Export) → Store in SharePoint/Excel → Load in Power BI
If a third-party connector isn’t an option — or if you prefer a no-cost / native tools path — you can use automation: periodically extract Planner data and store in a structured file (Excel, CSV) or SharePoint list, then connect that file/list to Power BI. (Microsoft Learn)
Typical workflow:
Building Your First Planner → Power BI Dashboard — Step by Step
Step 3: Transform & Model Data
Once data is loaded:
Some useful visuals and dashboards:
Use Cases & Benefits for Different Roles

Whether you’re an IT professional wanting oversight, a project manager tracking deliverables, or an executive needing high-level visibility — Planner → Power BI dashboards bring clarity, accountability, and data-driven decision-making to your workflows.
Start small: connect one plan or team, build a basic dashboard (e.g. task status and completion rate), and iterate. Over time, expand to full-scale reporting across teams, projects, and periods — unlocking the full potential of your task data.
Unlock actionable insights by connecting Microsoft Planner with Power BI — learn how IT professionals and project managers can build dynamic dashboards from Planner data to track tasks, monitor progress, and improve decision-making.
Introduction
Microsoft Planner is widely used for task and project management across teams — offering a simple, flexible way to create plans, assign tasks, and track progress. However, Planner by itself offers only basic visualizations and limited reporting capabilities. As organizations scale and the number of tasks and plans grow, manual tracking becomes inefficient and error-prone.
Microsoft Planner is widely used for task and project management across teams — offering a simple, flexible way to create plans, assign tasks, and track progress. However, Planner by itself offers only basic visualizations and limited reporting capabilities. As organizations scale and the number of tasks and plans grow, manual tracking becomes inefficient and error-prone.

This is where Microsoft Power BI comes in. By combining Planner with Power BI, you can transform raw task data into insightful dashboards, real-time reports, and analytics that help you understand project health, team workload, completion rates, and more.
In this guide, you’ll discover several effective methods — from no-code connectors to API-based workflows — for bringing Planner data into Power BI. Then you’ll learn how to build powerful dashboards to turn task data into meaningful insights.
Why Combine Planner with Power BI?
Gain Project Visibility and Transparency
When multiple planners, plans, and teams are involved, it’s hard to get a holistic view. With Planner → Power BI integration, you can view:
When multiple planners, plans, and teams are involved, it’s hard to get a holistic view. With Planner → Power BI integration, you can view:
- All tasks across plans and buckets
- Status of tasks (to-do, in-progress, done, overdue)
- Due dates and upcoming deadlines
- Assignment and workload distribution across team members
Enable Data-Driven Decision Making
With dashboards, you can track key metrics like:
With dashboards, you can track key metrics like:
- Task completion rate over time
- Overdue tasks trend
- Workload per team member
- Bottlenecks (tasks staying in certain buckets)
Automate Reporting and Dashboards
Once you set up data connection and refresh, dashboards can auto-refresh — eliminating manual exports or repeated Excel updates. This gives near real-time intelligence into project status.
Once you set up data connection and refresh, dashboards can auto-refresh — eliminating manual exports or repeated Excel updates. This gives near real-time intelligence into project status.
Support Multiple Roles
Whether you’re an IT professional, project manager, Microsoft 365 admin, or BI user — connecting Planner with Power BI helps all stakeholders: teams get clarity; managers get oversight; execs get high-level health metrics.
Whether you’re an IT professional, project manager, Microsoft 365 admin, or BI user — connecting Planner with Power BI helps all stakeholders: teams get clarity; managers get oversight; execs get high-level health metrics.
Understanding the Challenge: Planner Doesn’t Natively Connect to Power BI
One major limitation: Planner does not have a native connector built into Power BI. (Microsoft Learn)
That means you cannot simply “Get Data → Planner” in Power BI out of the box. Instead, you must rely on alternative methods: using third-party connectors, exporting data via automation, or leveraging APIs/datafeeds for integration. (CData Software)
Depending on your setup (standard Planner, Planner Premium/Dataverse-based environment), available options may vary. (Microsoft Support)
Methods to Get Planner Data into Power BI
Use a Third-Party Connector (e.g. CData Connector)
One of the easiest ways to integrate Planner with Power BI is by using a specialized connector such as the CData Power BI Connector for Microsoft Planner. This connector enables Power BI Desktop (or Service via gateway) to access live Planner data directly. (CData Software)
How it works:
- Install the connector → configure a Data Source Name (DSN) for Planner. (CData Software)
- In Power BI Desktop, go to Get Data → CData Microsoft Planner → authenticate via your Microsoft 365 credentials. (CData Software)
- Choose data connectivity mode: Import (snapshot) or DirectQuery (live data) depending on data volume and refresh needs. (CData Software)
- Select the tables/views (tasks, plans, buckets, assignments) and load or edit data. (CData Software)
Once connected, you can build dashboards in Power BI just like with any other data source.
Use Automation (e.g., via Power Automate / Scheduled Export) → Store in SharePoint/Excel → Load in Power BI
If a third-party connector isn’t an option — or if you prefer a no-cost / native tools path — you can use automation: periodically extract Planner data and store in a structured file (Excel, CSV) or SharePoint list, then connect that file/list to Power BI. (Microsoft Learn)
Typical workflow:
- Create a scheduled flow (via Microsoft Power Automate) that uses Planner’s “List tasks” action to fetch current tasks. (Microsoft Learn)
- Export data into an Excel file, JSON file, or SharePoint list. (Microsoft Fabric Community)
- In Power BI, use “Get Data → Excel / SharePoint / CSV” to load the exported data.
- Configure refresh schedule to keep data up-to-date (daily, hourly, etc.), depending on how often your flow runs.
Use API / OData Feed (e.g. via Graph API or OData Server) to Pull Planner Data Dynamically
For more technical/enterprise-grade needs, you can fetch Planner data via API or expose it via an OData service — then connect that service to Power BI. This approach offers dynamic access and avoids manual exports. (SharePoint Stack Exchange)
For example:
This method can support real-time or frequent refresh, depending on API limits and authentication setup.
For more technical/enterprise-grade needs, you can fetch Planner data via API or expose it via an OData service — then connect that service to Power BI. This approach offers dynamic access and avoids manual exports. (SharePoint Stack Exchange)
For example:
- Use an OData server (or custom API wrapper) to connect to Planner data. (CData Software)
- In Power BI Desktop: Get Data → OData Feed → point to the API URL → authenticate → load data. (SharePoint Stack Exchange)
- Build data model and dashboards based on fetched data.
This method can support real-time or frequent refresh, depending on API limits and authentication setup.
Building Your First Planner → Power BI Dashboard — Step by Step
Step 1: Choose Your Data Integration Method
- If you have permissions and can install connectors: go with CData Connector — easiest & fastest.
- If you prefer native tools and no external installs: use Power Automate export to Excel/SharePoint → then Power BI.
- If you need real-time data and custom integration: use API/OData feed approach.
Step 2: Connect & Import Data into Power BI
- With Connector: Get Data → CData Microsoft Planner → Authenticate → Load/Import or DirectQuery.
- With Export method: Get Data → Excel / SharePoint / CSV → Load exported file.
- With API/OData: Get Data → OData Feed → Provide URL and credentials → Load data.
Step 3: Transform & Model Data
Once data is loaded:
- Create tables for tasks, plans, buckets, users, statuses, dates.
- Normalize data: separate dimensions and fact tables (e.g. user master table, status master, tasks table).
- Create a date dimension table for time-based analytics (task creation date, due date, completion date).
- If needed: clean columns, rename fields, filter data, remove duplicates.
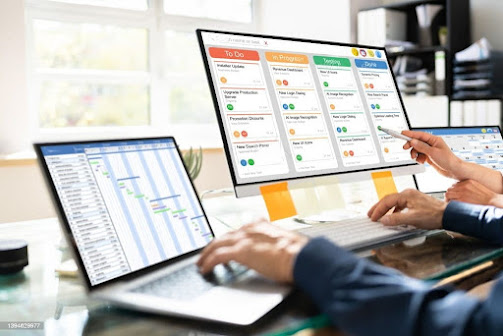
Some useful visuals and dashboards:
- Status Distribution Chart — showing number of tasks by status (To Do / In Progress / Done / Overdue)
- Burndown / Progress Chart — tasks created vs completed over time (daily/weekly/monthly)
- Assignee Workload Chart — show how many tasks assigned per user, overdue tasks per user, tasks by bucket per person
- Plan/Bucket Overview Dashboard — filter by plan or bucket to see progress, backlog, overdue tasks
- Trend Analysis & KPI Dashboard — completed tasks per period, average task completion time, backlog growth
- If using connector or API/OData — publish the report to Power BI Service.
- Use a gateway if required (on-premises, or if connector requires it) to enable data refresh. (CData Software)
- Schedule data refresh (e.g. hourly, daily) so dashboards stay updated.
- Share dashboards with team or embed in SharePoint / Teams for stakeholders.
Use Cases & Benefits for Different Roles
Project Managers & Team Leads
- Get a consolidated view of all tasks across multiple plans.
- Monitor delays, overdue tasks, and workloads across team members.
- Generate periodic status reports (weekly, monthly) automatically without manual effort.
IT Professionals & Microsoft 365 Admins
- Audit and monitor task distribution, SLA compliance across teams.
- Analyze historical trends — e.g., tasks completed over time, recurring bottlenecks.
- Use dashboards to optimize resource allocation, workload balancing.
Executives & Stakeholders
- High-level dashboards summarizing project health, team productivity, overdue/backlog tasks, and completion rates.
- Data-driven insights to inform project planning, staffing decisions, and priority adjustments.
Best Practices & Tips for Effective Planner → Power BI Dashboards
- Use consistent naming conventions: for plan names, bucket names, status labels — ensures data is clean and easy to filter/group.
- Build a clean data model: separate dimension tables (users, status, buckets) and a main tasks fact table — helps with scalability and easier addition of new attributes.
- Be mindful of performance: for large datasets, prefer DirectQuery or incremental refresh instead of full import.
- Design intuitive visuals: use charts and dashboards that highlight key metrics — overdue tasks, workload, completion trends — avoid clutter.
- Set up regular refresh: if using live connectors, ensure scheduled refresh or gateway is configured so dashboards reflect up-to-date data.
- Ensure data integrity & governance: especially when using exports or APIs — validate data for duplicates or missing fields.
- Engage stakeholders: build dashboards based on stakeholder needs — what insights are most useful for them (e.g. overdue tasks vs resource load vs completion velocity).
Conclusion
By connecting Microsoft Planner with Power BI, organisations transform basic task lists into powerful analytics platforms. Despite the lack of a built-in native connector, several effective methods — connectors, automation + export, API/OData — make this integration achievable and scalable.
By connecting Microsoft Planner with Power BI, organisations transform basic task lists into powerful analytics platforms. Despite the lack of a built-in native connector, several effective methods — connectors, automation + export, API/OData — make this integration achievable and scalable.

Whether you’re an IT professional wanting oversight, a project manager tracking deliverables, or an executive needing high-level visibility — Planner → Power BI dashboards bring clarity, accountability, and data-driven decision-making to your workflows.
Start small: connect one plan or team, build a basic dashboard (e.g. task status and completion rate), and iterate. Over time, expand to full-scale reporting across teams, projects, and periods — unlocking the full potential of your task data.
FAQs
Q1: Does Microsoft Planner have a built-in connector to Power BI?
No. Currently, Planner does not offer a direct built-in connector to Power BI. Integration requires third-party connectors, export workflows, or API/OData feeds. (Microsoft Learn)
Q2: Do I need third-party tools or licenses to connect Planner with Power BI?
Not always. You can use native automation (Power Automate) and export workflows — though using a third-party connector simplifies setup and supports live data.
Q3: What’s the best way to get live Planner data into Power BI?
Using a dedicated connector (like the CData Planner connector) or an API/OData feed — both support live or DirectQuery modes, enabling real-time dashboards.
Q4: Can I use Power Automate to export Planner tasks into Excel/SharePoint and then use Power BI?
Yes — this is a common approach for organisations without third-party connectors. Schedule regular exports and connect Power BI to the exported files or SharePoint lists.
Q5: What kinds of dashboards and reports are most useful when combining Planner & Power BI?
- Task status distribution (to-do, in-progress, done, overdue)
- Progress over time (burndown, completion trends)
- Workload per assignee / team
- Plan/bucket overview (backlog, upcoming due tasks)
- Resource utilization and bottleneck analysis

Comments
Post a Comment